Анализ чувствительности
Что такое Анализ чувствительности?
Анализ чувствительности определяет, как различные значения независимой переменной влияют на конкретную зависимую переменную при заданном наборе допущений. Другими словами, анализ чувствительности изучает, как различные источники неопределенности в математической модели влияют на общую неопределенность модели. Этот метод используется в определенных границах, которые зависят от одной или нескольких входных переменных.
Ключевые моменты
Как работает анализ чувствительности
Анализ чувствительности – это финансовая модель, которая определяет, как на целевые переменные влияют изменения в других переменных, известных как входные переменные. Эта модель также называется анализом «что если» или имитационным анализом. Это способ предсказать результат решения с учетом определенного диапазона переменных. Создавая заданный набор переменных, аналитик может определить, как изменения одной переменной влияют на результат.
И целевая, и входная – или независимые и зависимые – переменные полностью анализируются при проведении анализа чувствительности. Человек, выполняющий анализ, смотрит, как движутся переменные, а также как на цель влияет входная переменная.
Краткая справка
Инвесторы также могут использовать анализ чувствительности, чтобы определить влияние различных переменных на их инвестиционную доходность.
Анализ чувствительности позволяет прогнозировать, используя исторические достоверные данные. Изучая все переменные и возможные результаты, можно принимать важные решения относительно бизнеса, экономики и инвестиций.
Пример анализа чувствительности
Предположим, Сью – менеджер по продажам, который хочет понять, как трафик клиентов влияет на общий объем продаж. Она определяет, что продажи зависят от цены и объема транзакции. Цена виджета составляет 1000 долларов, а в прошлом году Сью продала 100 штук, а общий объем продаж составил 100 000 долларов. Сью также определяет, что увеличение клиентского трафика на 10% увеличивает объем транзакций на 5%. Это позволяет ей построить финансовую модель и провести анализ чувствительности на основе этого уравнения на основе утверждений «что, если». Он может сказать ей, что произойдет с продажами, если клиентский трафик увеличится на 10%, 50% или 100%. На основе 100 транзакций сегодня увеличение клиентского трафика на 10%, 50% или 100% соответствует увеличению транзакций на 5%, 25% или 50% соответственно. Анализ чувствительности показывает, что продажи очень чувствительны к изменениям в потоке клиентов.
Чувствительность и анализ сценария
Анализ чувствительности основан на переменных, влияющих на оценку, которые финансовая модель может отобразить с помощью цены переменных и EPS. Анализ чувствительности изолирует эти переменные, а затем записывает диапазон возможных результатов. С другой стороны, для анализа сценария аналитик определяет определенный сценарий, такой как крах фондового рынка или изменение отраслевого регулирования. Затем он изменяет переменные в модели в соответствии с этим сценарием. В совокупности у аналитика есть полная картина. Теперь он знает полный спектр результатов с учетом всех крайностей и понимает, какими будут результаты, учитывая конкретный набор переменных, определяемых сценариями реальной жизни.
Преимущества и ограничения анализа чувствительности
Проведение анализа чувствительности дает ряд преимуществ лицам, принимающим решения. Во-первых, он действует как углубленное изучение всех переменных. Поскольку он более подробный, прогнозы могут быть гораздо более надежными. Во-вторых, это позволяет лицам, принимающим решения, определить, где они могут внести улучшения в будущем. Наконец, это дает возможность принимать обоснованные решения относительно компаний, экономики или их инвестиций.
Но у использования такой модели есть некоторые недостатки. Все результаты основаны на предположениях, поскольку все переменные основаны на исторических данных. Это означает, что он не совсем точен, поэтому при применении анализа к будущим прогнозам может быть место для ошибки.
sensitivity analysis
Смотреть что такое «sensitivity analysis» в других словарях:
Sensitivity analysis — (SA) is the study of how the variation (uncertainty) in the output of a mathematical model can be apportioned, qualitatively or quantitatively, to different sources of variation in the input of a model Saltelli, A., Ratto, M., Andres, T.,… … Wikipedia
sensitivity analysis — sensitivity test, sensitivity analysis A single variant test to see how dependent a forecast, projection or stress test outcome is upon a single, selected variable or assumption. For example, a bank AL manager might perform a sensitivity analysis … Financial and business terms
Sensitivity analysis — Analysis of the effect on a project s profitability due to changes in sales, cost, and so on. The New York Times Financial Glossary * * * sensitivity analysis sensitivity analysis ➔ analysis * * * sensitivity analysis UK US noun [C] ► the… … Financial and business terms
Sensitivity Analysis — A technique used to determine how different values of an independent variable will impact a particular dependent variable under a given set of assumptions. This technique is used within specific boundaries that will depend on one or more input… … Investment dictionary
sensitivity analysis — jautrumo analizė statusas Aprobuotas sritis branduolinė sauga apibrėžtis Analizė, atliekama siekiant nustatyti, kaip keičiasi analizuojamų rezultatų vertės nuosekliai keičiant branduolinės elektrinės tikimybinės saugos analizės modelio parametrų… … Lithuanian dictionary (lietuvių žodynas)
sensitivity analysis — A form of analysis used in approaches to business problems, in which possible changes to the variables are subjected to the decision making technique to examine the range of possible outcomes and to determine the sensitivity of the projected… … Accounting dictionary
sensitivity analysis — A method of analysing the sensitivity of a decision to a change in one or more of the assumptions used in making it. For instance, a company might analyse how its future performance might be affected by changing its level of advertising or by… … Big dictionary of business and management
sensitivity analysis — /ˌsensə tɪvəti əˌnæləsɪs/ noun the analysis of the effect of a small change in a certain calculation on the final result … Dictionary of banking and finance
sensitivity analysis — presentation of possible results and ways to create the result in a process which involves uncertain factors by assigning different values for these factors … English contemporary dictionary
Average rate in interest sensitivity analysis — The average interest rate of total remaining assets or liabilities (See also Remaining product life time interest sensitivity) in each specified time period … International financial encyclopaedia
Break even rate in interest sensitivity analysis — The average interest rate of the funding (negative gap) or the average interest rate of the lending (positive gap) necessary to break even (zero profit) the mismatch in each specified time period. See also Risk management … International financial encyclopaedia
Sensitivity Analysis
What is Sensitivity Analysis?
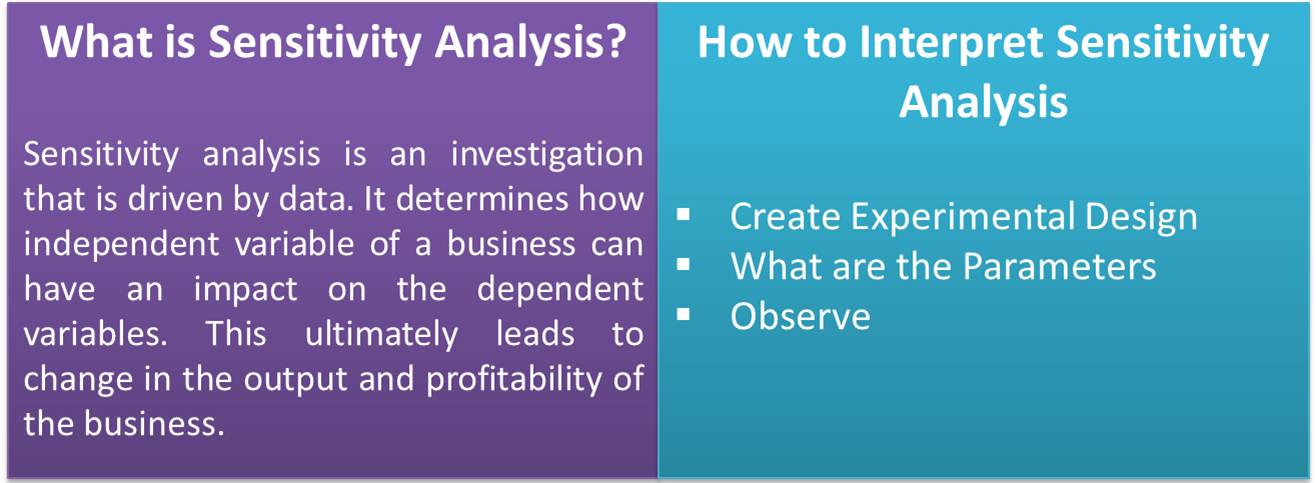
Sensitivity analysis is an investigation that is driven by data. It determines how independent variable of a business can have an impact on the dependent variables. This ultimately leads to change in the output and profitability of the business. This concept is employed to evaluate the overall risk and identify critical factors of the business. By doing so, the business tries to find alternative solutions for different problems.
After sensitivity analysis definition, let’s take an example to further clarify the concept.
Example of Sensitivity Analysis
Suppose an organization is making mobile cases and covers. Every month many new mobile releases and many older mobiles go out of the market. In the given case, the business has two options i.e. either to wait for the new launch of mobiles every month or keep producing the cases for older mobiles. If the business keeps waiting for the launch of new phones, the number of cases that it could have sold will not contribute to the profits. Therefore, the business will have to determine how many cases need to be produced. Hence, a number of cases to be produced are dependent variable here.
It is very important to rightly interpret the sensitivity analysis study. So, let us have a look at how to interpret it.
How to Interpret Sensitivity Analysis
The interpretation of the sensitivity analysis can be done by keeping the following factors in mind:
Create Experimental Design
It is important to create an experimental design of the business model and find what parameters can affect it the most. By assigning different values to different variables ranging from minimum to maximum, one can know the immediate and long-term effect of various parameters on business. Find the best suitable combination and apply it in the business model.
What are the Parameters
To correctly interpret the results, the parameters selected should be right. The parameters can be different for different models of business. However, the common parameters may include technical parameters, number of activities involved in business, number of bottlenecks, risk, and effect of bottlenecks on business, etc. Selection of right parameters will help in arriving at a right interpretation of the analysis.
Observe
Once the analysis is done with different parameters and combinations, the next step is observation. Observation is important as it determines which strategy must be followed by the business for higher growth and profit maximization. The observation may involve; the outcome of analysis based on different decision variables, the impact of different variables and parameters on the strategy of the business, any ratifications to be made in the strategy, etc.
Sensitivity analysis can be evaluated by using different methods. Let us have a look at the different methods.
Methods of Sensitivity Analysis
There are two methods for carrying the analysis. They are as follows.
Simulation and Modeling technique
Simulation and modelling is an age old technique to simulate a range of scenarios and see their outcomes.
Scenario Management using Microsoft Excel
Scenario Manager in Microsoft Excel is an excellent tool for conducting sensitivity analysis. Using this tool, you can easily define various scenarios and see their respective results.
Conclusion
There are various advantages and disadvantages of sensitivity analysis and it provides a solution to different problems of business under different situations. It helps the decision makers of business to learn about the different parameters that drive a business. Along with that, the business knows how each parameter affects its functioning and profitability. This analysis evaluates the best business model after considering the different bottlenecks and variables. The aim of sensitivity analysis is to arrive at such business model that results in higher EPS. To sum up, every business must conduct sensitivity analysis to stay ahead of its competitors and for higher growth as well as sustainability.

Sanjay Bulaki Borad
Sanjay Borad is the founder & CEO of eFinanceManagement. He is passionate about keeping and making things simple and easy. Running this blog since 2009 and trying to explain «Financial Management Concepts in Layman’s Terms».
Анализ чувствительности (sensitivity analysis)
Анализ чувствительности проводится в следующей последовательности:
Определяются наиболее значимые переменные (например, объем продаж, цена единицы продукции, переменные затраты на единицу продукции).
Определяются их ожидаемые, или базовые, значения.
Рассчитываются показатели NPV и IRR при базовых значениях.
Меняется значение переменной в определенных пределах и рассчитываются NPV и IRR при каждом новом значении переменной. Данную процедуру повторяют для каждой переменной.
Строятся графики зависимости NPV и IRR от изменяемой переменной.
Сравнивается чувствительность проекта к каждой переменной и определяются важнейшие из них.\r\nПример.\r\nОтклонение NPV(в тыс.$) при изменении\r\nот базового объема переменных затрат цены\r\nуровня, % продаж на единицу продукции капитала\r\n-10 7 944 20 287 13 772\r\n-5 10 010 16 181 12 905\r\n0 12 075 12 075 12 075\r\n+ 5 14 141 7 970 11 281\r\n+ 10 16 207 3 864 10 521\r\nа) объем реализации б) переменные затраты в) цена капитала

реализации, % затраты, % капитала, %
Рис. 4.3. Анализ чувствительности
Наклон линий показывает, насколько чувствителен NPV проекта к изменениям на каждом входе: чем круче наклон, тем чувствительнее NPV к изменению переменной.
NPV проекта очень чувствителен к изменению переменных затрат, довольно чувствителен к изменению объема продаж и относительно нечувствителен к изменению цены капитала (рис. 16.8).
В сравнительном анализе проект с более крутыми кривыми чувствительности считается более рисковым, поскольку сравнительно небольшая ошибка в оценке переменной, например, переменных затрат на единицу продукции, дает большую ошибку в прогнозируемой NPV проекта. Таким образом, анализ чувствительности может помочь проникнуть в суть рисковости проекта. Существуют и другие способы, с помощью которых модифицируются методы оценки инвестиционных расчетов с целью учета возможного риска.
Сущность имитационной модели оценки риска, являющейся наиболее распространенным при проведении анализа чувствительности, заключается в следующем.
На основе экспертной оценки по каждому проекту строят три возможных варианта развития событий: пессимистичный, наиболее реальный и оптимистичный.
Для каждого варианта рассчитывается соответствующий показатель NPV.
или среднее квадратическое отклонение по формуле:
Из двух сравнимых проектов считается более рискованным тот, у которого больше вариационный размах (RNPV) или среднее квадратическое отклонение G NPV.
All you want to know about Sensitivity Analysis
March 29 2018 Written By: EduPristine
What is Sensitivity Analysis?
The technique used to determine how independent variable values will impact a particular dependent variable under a given set of assumptions is defined as sensitive analysis. It’s usage will depend on one or more input variables within the specific boundaries, such as the effect that changes in interest rates will have on a bond’s price.
It is also known as the what – if analysis. Sensitivity analysis can be used for any activity or system. All from planning a family vacation with the variables in mind to the decisions at corporate levels can be done through sensitivity analysis.

Sensitivity analysis works on the simple principle: Change the model and observe the behavior.
The parameters that one needs to note while doing the above are:
A) Experimental design: It includes combination of parameters that are to be varied. This includes a check on which and how many parameters need to vary at a given point in time, assigning values (maximum and minimum levels) before the experiment, study the correlations: positive or negative and accordingly assign values for the combination.
B) What tfo vary:The different parameters that can be chosen to vary in the model could be:
a) the number of activities
b) the objective in relation to the risk assumed and the profits expected
c) technical parameters
d) number of constraints and its limits
C) What to observe:
a) the value of the objective as per the strategy
b) value of the decision variables
c) value of the objective function between two strategies adopted
Measurement of sensitivity analysis
Below are mentioned the steps used to conduct sensitivity analysis:
This process of testing sensitivity for another input (say cash flows growth rate) while keeping the rest of inputs constant is repeated until the sensitivity figure for each of the inputs is obtained. The conclusion would be that the higher the sensitivity figure, the more sensitive the output is to any change in that input and vice versa.
Methods of Sensitivity Analysis
There are different methods to carry out the sensitivity analysis:
There are mainly two approaches to analyzing sensitivity:
Local sensitivity analysis is derivative based (numerical or analytical). The term local indicates that the derivatives are taken at a single point. This method is apt for simple cost functions, but not feasible for complex models, like models with discontinuities do not always have derivatives.
Mathematically, the sensitivity of the cost function with respect to certain parameters is equal to the partial derivative of the cost function with respect to those parameters.
Local sensitivity analysis is a one-at-a-time (OAT) technique that analyzes the impact of one parameter on the cost function at a time, keeping the other parameters fixed.
Global sensitivity analysis is the second approach to sensitivity analysis, often implemented using Monte Carlo techniques. This approach uses a global set of samples to explore the design space.
The various techniques widely applied include:
Through the sensitivity index one can calculate the output % difference when one input parameter varies from minimum to maximum value.
Using Sensitivity Analysis for decision making
One of the key applications of Sensitivity analysis is in the utilization of models by managers and decision-makers. All the content needed for the decision model can be fully utilized only through the repeated application of sensitivity analysis. It helps decision analysts to understand the uncertainties, pros and cons with the limitations and scope of a decision model.
Most if not all decisions are made under uncertainty. It is the optimal solution in decision making for various parameters that are approximations. One approach to come to conclusion is by replacing all the uncertain parameters with expected values and then carry out sensitivity analysis. It would be a breather for a decision maker if he/she has some indication as to how sensitive will the choices be with changes in one or more inputs.
Uses of Sensitivity Analysis
Conclusion
Sensitivity analysis is one of the tools that help decision makers with more than a solution to a problem. It provides an appropriate insight into the problems associated with the model under reference. Finally the decision maker gets a decent idea about how sensitive is the optimum solution chosen by him to any changes in the input values of one or more parameters.